“The List Screen Is Slow”
A list screen is a service’s front door. Users open and close it dozens of times a day, so when that door gets heavy, the complaints come in first and loudest.
The system I help run (agricultural production history tracking, Spring Boot + JPA/Hibernate + PostgreSQL) had one of those doors: the harvest history list API. Press the search button, and the response took 10 to 15 seconds. Wondering if the page had died, you hit refresh, and it was another 15 seconds. When I opened the code, nothing looked off. It was ordinary code that fetched a list from the repository and handed it to the screen.
When ordinary-looking code is burning 15 seconds, stop looking at the code and look at the ‘work it orders.’ In the last post, I compared the database to a warehouse and JPA to an interpreter on staff. This incident is the record of checking how I had been giving that interpreter its orders.
I Turned On the Logs and Counted
JPA’s convenience comes from keeping SQL out of sight. And 90% of the problems live in that unseen SQL. So the first step was dropping the log level to debug so that Hibernate would print every SQL statement it actually ran.
I called the list API once. SQL started pouring down the console. It poured, and poured, and kept on pouring. The number of queries it took to build one ‘page’ of the list was in the ‘thousands.’
In warehouse terms: I asked the interpreter, “Pull me one page of the harvest history list,” and the interpreter was making thousands of round trips to the warehouse. Carrying one item per trip.
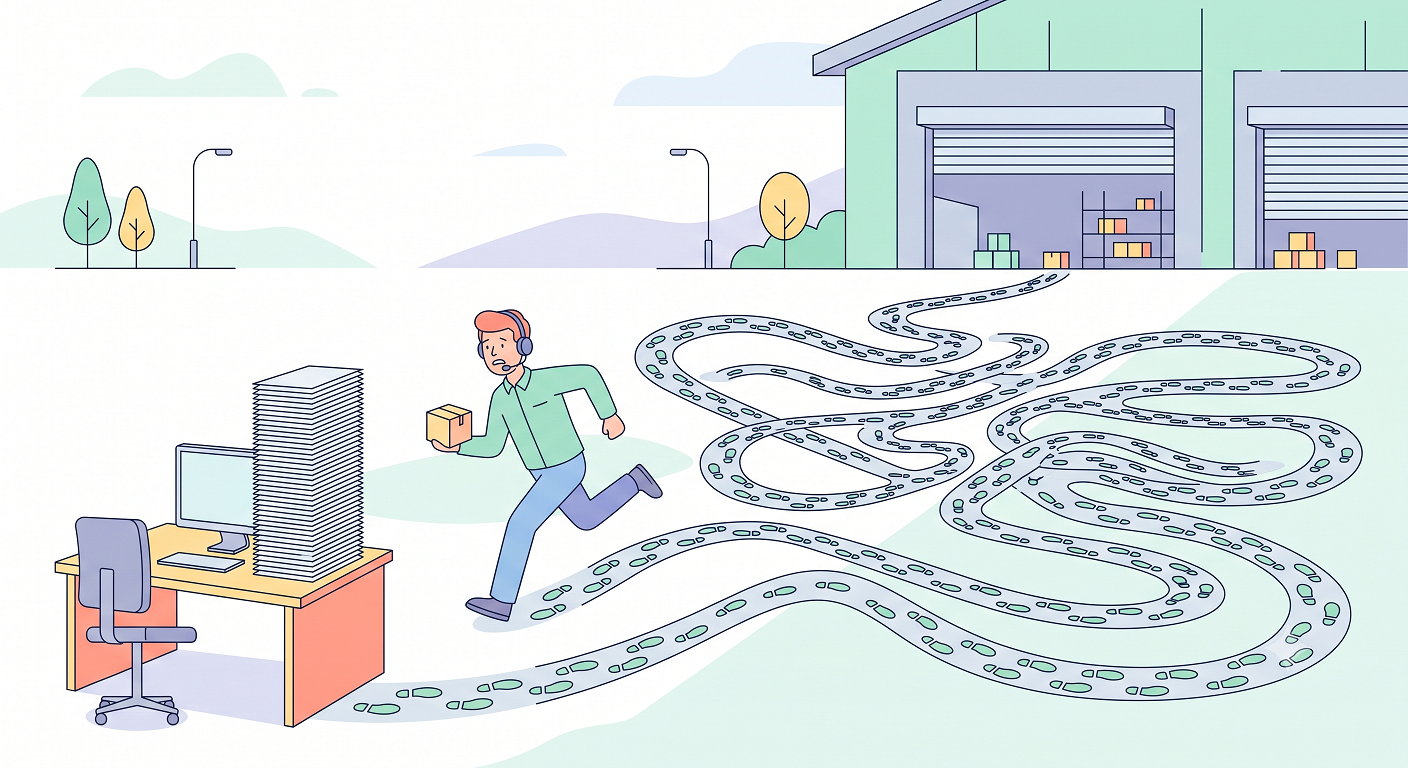
The moment you count the number with your own eyes, the problem is half solved. All that’s left is figuring out ‘why thousands.’
Why Thousands? How N+1 Works
By default, JPA fetches associated data ‘lazily’ (LAZY). When you load a harvest entity, it doesn’t bring all the related data along. Instead, it fires off a query on the spot each time the code actually touches that data. Normally that’s a sensible strategy: there’s no reason to haul data you won’t use.
The trouble is lists. This system’s Harvesting entity had ‘7’ LAZY associated collections hanging off it: drying, packaging, disposal targets, inspections, sorting targets, items, and cultivation info. One list query fetches N harvests. Then, the moment you touch each row’s collections to fill in what the screen needs, a separate query goes out for every row and every collection. One list query drags N×7 queries along behind it. That’s the ‘N+1 problem.’
This system went one better. Tag information meant walking four levels down: ‘harvest → cultivation → pot → attached tag → tag.’ Every level has a LAZY boundary, so the round trips multiply. ‘Thousands’ wasn’t an exaggeration. It was arithmetic.
There Wasn’t Just One Cause
I knew this much: “You fix N+1 with a fetch join.” A fetch join is JPQL syntax that brings the associated data along in the same query from the start, and there’s also @EntityGraph, which does a similar job through an annotation. But this is where the incident parts ways with the textbook. Applying the prescription didn’t cure the disease. A different one popped up.
The first wall. When I set up @EntityGraph to fetch two collections together, Hibernate threw an exception.
org.hibernate.loader.MultipleBagFetchException:
cannot simultaneously fetch multiple bags
Hibernate calls a List-typed collection with no guaranteed order a ‘bag,’ and it doesn’t allow eagerly fetching two or more bags at once in a single query. For an entity with seven collections, that restriction is fatal.
The second wall. So what if I widened the fetch paths this way and that? Collection joins inflate the result rows into a ‘Cartesian product.’ If one harvest has 3 drying records and 4 packaging records attached, the join produces 3×4=12 rows. Tie together just a few collections and the row count explodes. The database ends up hauling not a page’s worth of data but a truckload.
The third wall was outside the query. Reading further into the code, I found that this API didn’t leave paging to the database. It loaded ‘all the data’ into memory with Pageable.unpaged(), filtered on remaining stock (the quantity left in inventory) in Java, and cut out the page by hand. The reasoning was that remaining stock is a computed value, which makes it hard to filter with a SQL WHERE clause. The result: every single request turned into a full scan.
Put together, those 15 seconds weren’t the price of N+1 alone. They were a four-part compound bill: ‘N+1 × bag restriction × Cartesian product × full load.’
The Prescription: Not One Silver Bullet, but a Division of Labor
The fix wasn’t a single cure-all. It was giving each tool its own territory. Here’s the combination we actually applied.
| Action | Role |
|---|---|
Collection type List → Set | Sidesteps the bag restriction (MultipleBagFetchException) |
@BatchSize(size = 100) | Turns N individual queries into IN (id1, ..., id100) batch queries: N round trips become N/100+1 |
Only @ManyToOne in @EntityGraph | Join only single-valued associations that don’t multiply rows, and hand every collection to BatchSize |
hibernate.default_batch_fetch_size=100 | Makes the strategy above the global default |
| Database paging first | Dropped unpaged(). Fetch only the page, and apply the remaining-stock filter only within that page |
To wrap it up in warehouse terms: we didn’t eliminate the round trips. We handed the interpreter a ‘100-box cart’ (BatchSize) and sorted out which loads need the truck (collections) and which can be carried by hand (single-valued associations).
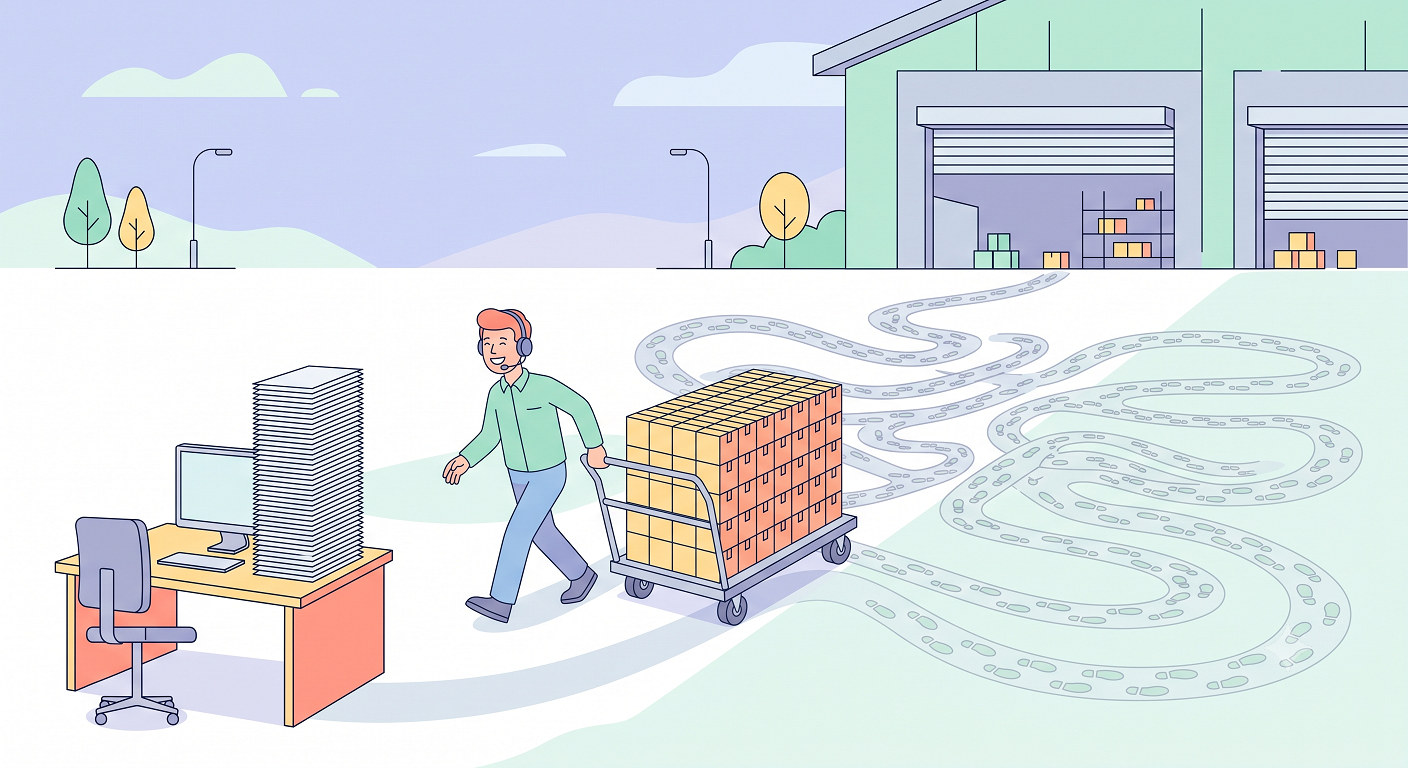
That last row matters. ‘Apply the remaining-stock filter only within the page’ isn’t free. Filter page by page, and the number of items shown can vary from one page to the next. It’s a trade-off: we gave up a little filtering accuracy to secure response time, and we wrote that choice down in the documentation exactly as it was. As with any prescription, the record of side effects is part of the prescription.
The result: responses that took 10 to 15 seconds came down to ‘around 0.5 seconds.’ Another list API with the same family of problems (N+1, compounded by dead joins and no pagination) that had gone as high as 5 minutes came down to a few seconds with the same approach.
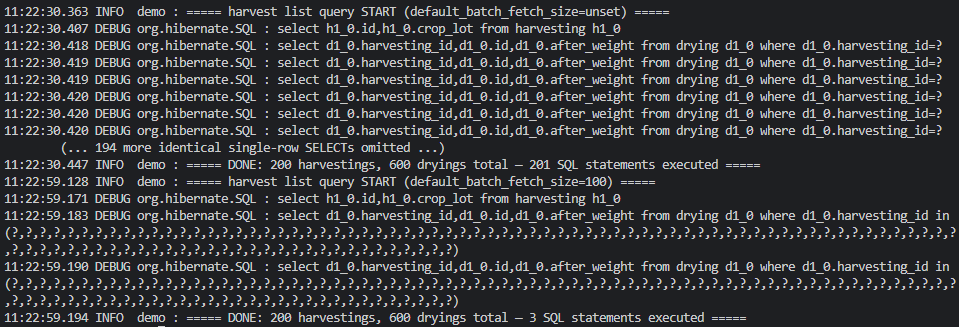
I reproduced the same pattern locally in a mini demo with two entities (a LAZY collection from harvest to drying): 200 harvests × 3 drying records each. Running the list with no batch setting produced ‘201 SQL statements’ according to Hibernate’s statistics (1 for the list + 200 for the collections). Turning on just default_batch_fetch_size=100 brought it down to ‘3 SQL statements’ (1 for the list + 2 IN batches of 100). From 201 to 3: one sixty-seventh.
The rows of question marks in the IN clauses in the log below aren’t garbled output. Hibernate doesn’t put values directly into the SQL string. It uses PreparedStatement, which binds each value separately into a ? placeholder, so 100 question marks are proof that it ‘asked for 100 IDs at once.’ The reproduction code is in the demo folder of my study notes repository, so feel free to run it yourself.
Practical Advice: Make a Habit of Counting Queries
Here are the notes this incident left me with.
- The diagnosis ‘JPA is slow’ is usually wrong. What’s slow is the developer who ‘doesn’t look at’ the SQL JPA generates. If you’ve built a list API, count the queries in the debug log at least once. Counting takes 5 minutes. Not counting gets you a 15-second API.
- Fetch join,
@EntityGraph, and@BatchSizearen’t competitors; they split the work. Join the single-valued associations that don’t multiply rows, and batch the collections. The test is ‘Does this association multiply the number of result rows?’ - The trade-offs of a performance fix live in the documentation, not in the code. If you don’t write down ‘what you gave up,’ the next person (usually future you) will mistake that compromise for a bug.
Wrapping Up: It Wasn’t Just One Bill
N+1 is probably the most-written-about JPA topic on Korean dev blogs. I knew the concept too. But real work doesn’t hand you concept problems one sheet at a time. The bag restriction, the Cartesian product, and the full load arrived bundled into a single bill, and what finally made me tear it open was ‘counting’ the SQL printed in the logs. That’s the first habit that stuck after I decided to relearn SQL: not distrusting the interpreter, but checking the interpreter’s work with my own eyes.
Yet even after this incident cut the query count to a hundredth, the list screen’s troubles weren’t over. Not long after, a report came in about a different list screen, and this time the culprit wasn’t the number of queries.